Columns
Tipsheet
Cartoons
Podcasts
Videos
MY ACCOUNT
Account Settings
Newsletter Subscriptions
Log Out
Subscribe
LOGIN
Login
MY ACCOUNT
Account Settings
Newsletter Subscriptions
Comment Settings
Log Out
LOGIN
Subscribe
Tipsheet
Columns
Cartoons
Podcasts
Videos
Contact Us
Terms & Conditions
Privacy Policy
California - Do Not Sell My Personal Information
California CCPA Notice
Advertisement
Senate
House
Governor
Other
Latest Election News
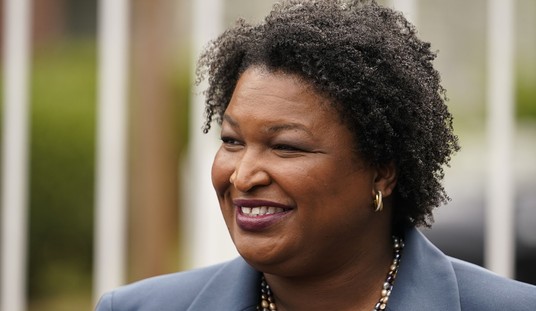
Stacey Abrams Has Found Another Job
Rebecca Downs
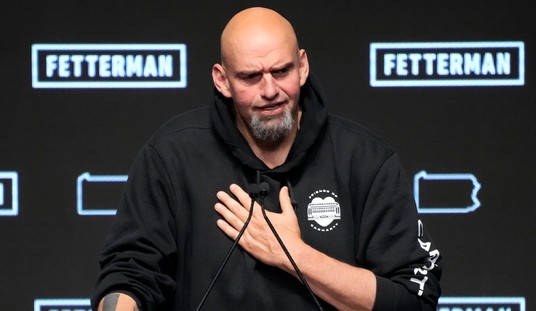
Sounds Like Sen. Fetterman Regrets Not Taking a Longer Break After Stroke
Julio Rosas
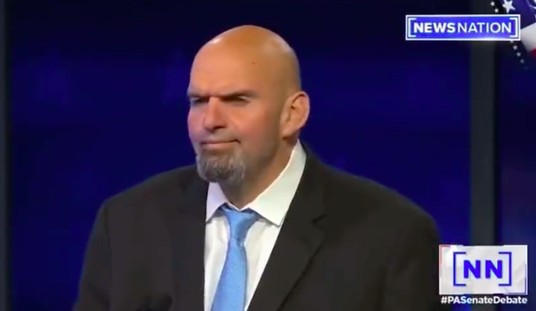
A New Stroke Was Ruled Out, But There's Another Reason Fetterman Remains Hospitalized
Leah Barkoukis
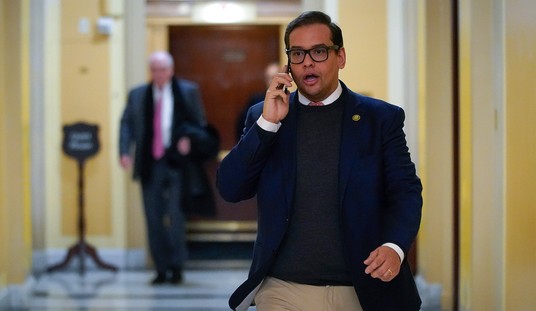
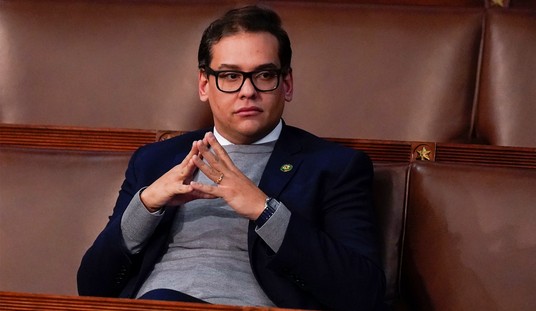
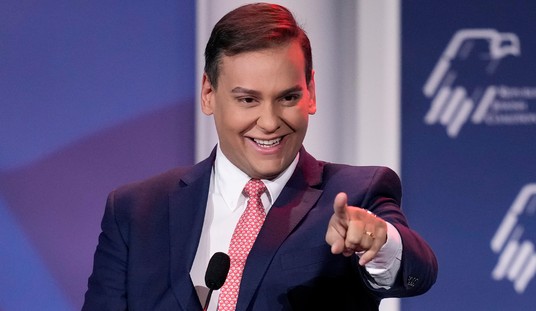
Rep. George Santos Is Indeed Under Investigation From House Ethics Committee
Rebecca Downs
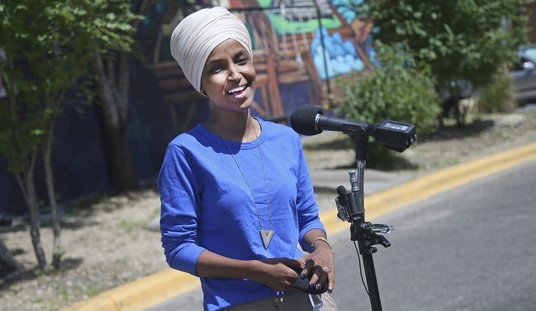
House Republicans Are Making Moves to Boot Omar From Foreign Affairs Committee
Rebecca Downs
Advertisement
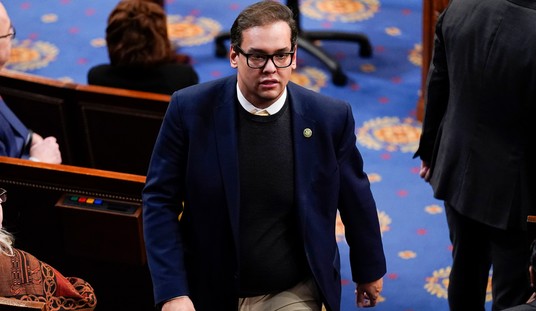
Rep. George Santos Steps Back From House Committee Assignments
Madeline Leesman
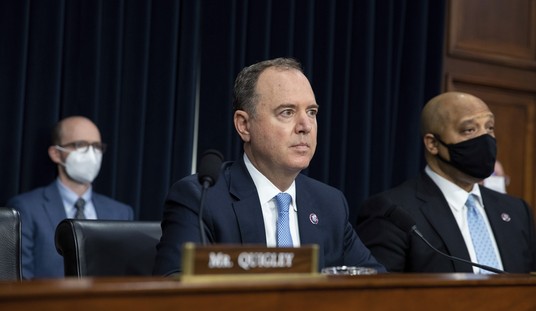
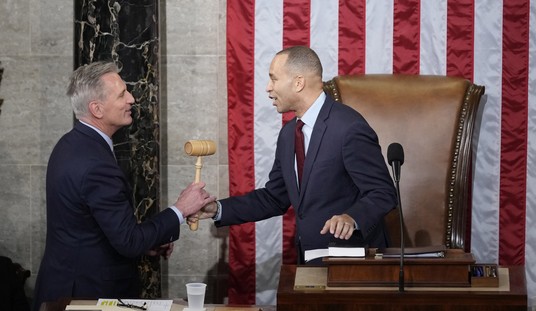
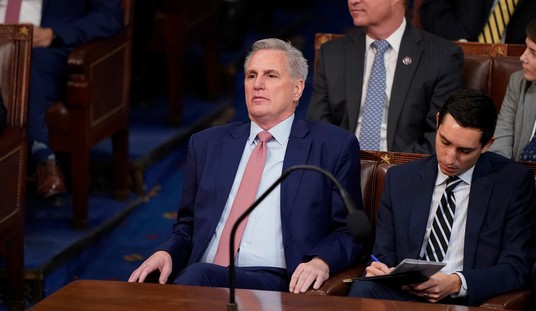
Schiff, Swalwell React to Jeffries Nominating Them for Intel Committee, Despite McCarthy's Threats
Rebecca Downs
Immigration Documents Contradict Rep. Santos’ Claim His Mother Was in NYC on 9/11
Madeline Leesman
Did George Santos Scam a Veteran Out of Donations for His Dying Dog?
Rebecca Downs
Rep. George Santos Gets Committee Assignments After All
Rebecca Downs
Advertisement
Poll: Do GOP Voters Want House Republicans to Work With Democrats, or Focus on Opposition?
Guy Benson
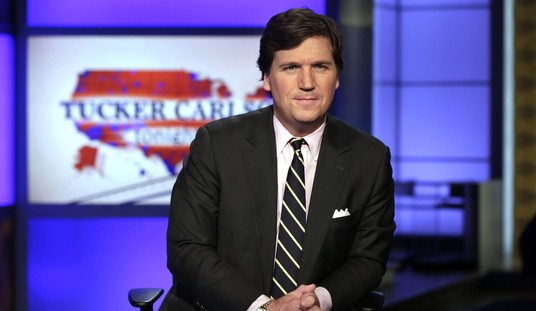
Carlson Makes a Surprising Admission About What the 2022 Midterms Made Him Realize
Leah Barkoukis
It's Not Hard to Figure Out Why Tucker Carlson Torched Ronna McDaniel
Matt Vespa
George Santos, a Child of Woke America
Star Parker
Ahead of Next Drama-Filled Speaker’s Vote, Bob Good Is One Member Who Won’t Cave in Opposing McCarthy
Rebecca Downs
Advertisement
Trump: I'm Not to Blame for the GOP's 2022 Underperformance...But Here's Who Is
Guy Benson
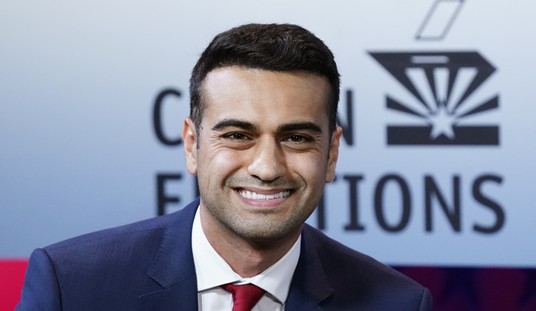
After 'Shocking Discrepancies' Democrat Declared the Winner in Arizona Race
Katie Pavlich
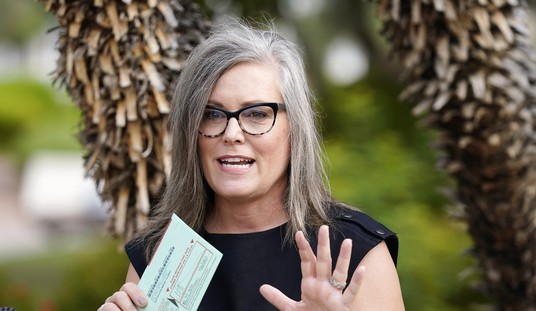
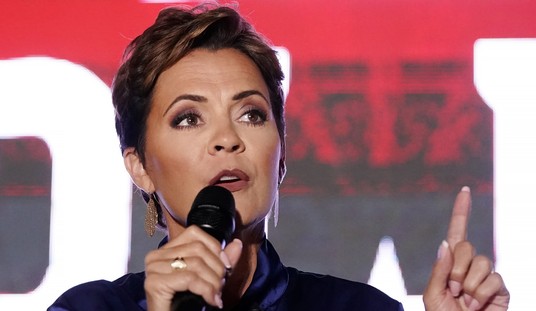
Dem Governor-Elect Katie Hobbs Seeks Sanctions Against Kari Lake Over Election Lawsuit
Madeline Leesman
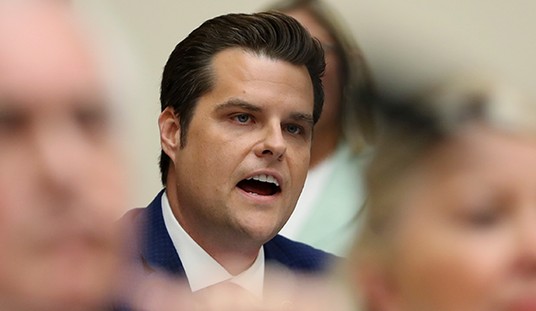
Here's Matt Gaetz's Christmas Wish...And I'm Sure a Lot of Conservatives Agree
Matt Vespa
Rep.-Elect George Santos Admits to Fabricating Work and Education Experience
Madeline Leesman
Advertisement
Judge Rejects Kari Lake’s Election Lawsuit Following Two-Day Trial
Madeline Leesman
Advertisement
Most Popular
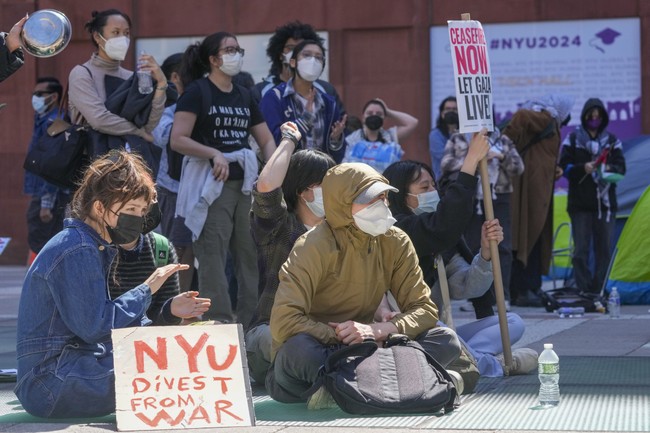
There’s a Massive Pushback Brewing Against the Pro-Hamas Thugs Taking Over College Campuses
Pro-Hamas Supporters at LSU Didn't Know What to Do When the Fraternities Showed Up
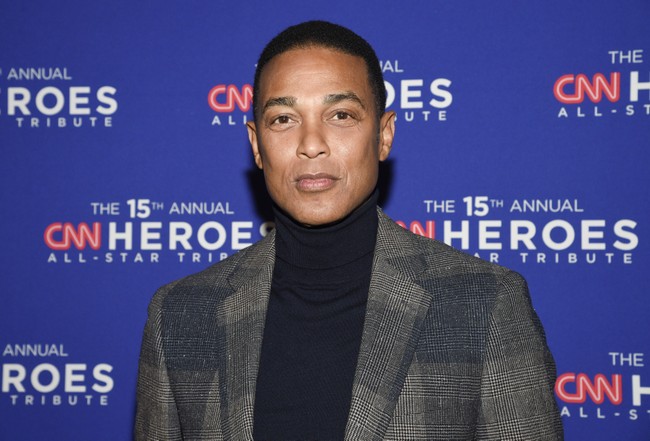
Watch Don Lemon Shut Down WaPo's Taylor Lorenz Over This Take About Gaza and Gay Rights
Why Intellectuals Don't Like Capitalism
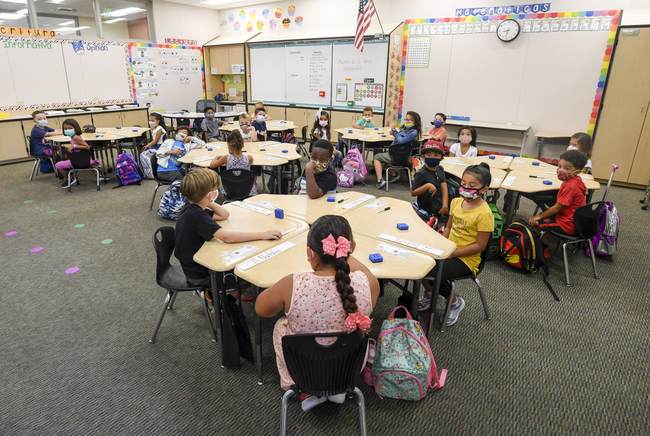
The Left’s New School Choice Playbook in Arkansas Serves as a National Warning
The Truth About the CIA
Trump Narrows His VP List Down to These Four Potential Candidates
Here's a Liberal Policy That Now Has Bill Maher 'Incensed'
Matt Vespa
Advertisement


