In recent weeks, I’ve pontificated on Obama’s spendthrift budget, Congressman Dave Camp’s timid tax reform plan,  and the corrupt cronyism of Washington.
I got to elaborate on all these topics – and more – in this interview with Professor Glenn Reynolds, more widely known as Instapundit.
If there was an overall theme, it’s that President Obama’s statist agenda is not helping the country.
Other than my hair looking strange, I think this was a good interview.
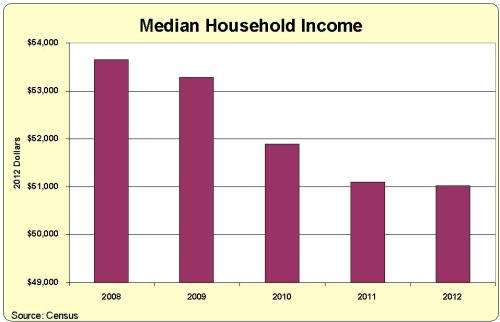
But here’s a point I probably should have included when assessing the President’s performance. If you look at the Census Bureau’s data on median household income (adjusted for inflation), you’ll see that the median American is earning less during the Obama years. And that’s true whether you use 2008 or 2009 as the base year.
Now let me provide three caveats on this data, two that help Obama and another that is less favorable.
1. First, if you look at the historical data from the Census Bureau, you’ll see that median household income is a lagging indicator. That means that incomes don’t improve in the first year or two of a recovery.
In other words, you can argue, with considerable justification, that Obama inherited bad numbers.
2. Second, median household income is an incomplete measure of living standards. If you peruse the data, you’ll see that median income for 2012 (the latest available year) is lower than it was the year Reagan left office.
I’m a big Reagan fan, so I’m tempted to say the country has lost ground since he left office, but that would be an exaggeration. We obviously have higher living standards today, notwithstanding the Census Bureau numbers.
Recommended
3. But I’m not making excuses for Obama. My third and final caveat is that the median numbers don’t tell the full story. If you look at the Census Bureau’s numbers for various income groups, you’ll see that the only cohort that has enjoyed higher real income during the Obama years is….drum roll, please…the rich!
You read correctly. The bottom 20 percent have suffer lower incomes. The three middle-income quintiles have lost ground. Even the top 20 percent have lower median incomes. The only group that is ahead is the top 5 percent.
In other words, Obama may use lots of class-warfare rhetoric to pretend he’s on the side of ordinary people.
But his policies (TARP, Solyndra, etc) have been enormously beneficial to the cronyists and insiders that have made the Washington metropolitan area so wealthy.
Here’s some of what Senator Portman of Ohio had to say about the topic.
It’s been five years since the experts said the recession was over, but for millions of Americans, it feels like it never ended. We’re living through the weakest economic recovery since World War II, and a lot of folks are struggling to make ends meet. Unemployment remains stubbornly high; the number of long-term unemployed is actually at record levels. But these statistics only tell half the story. Eleven million Americans have become so discouraged that they’ve given up looking for work altogether. Poverty rates have gone up, salaries have gone down, with the average family now bringing home $4,000 less than they did just five years ago.
Just in case you doubt Portman’s remarks, here’s the chart I produced using data from the Minneapolis Federal Reserve Bank.
It shows every recovery since end of World War II. The red line is Obamanomics.
Hmmm….this is almost enough to make one think that maybe we should try free markets and small government instead.
P.S. This Gary Varvel cartoon provides a good synopsis of Obama’s economic policy.

I also like Varvel’s take on Obamacare, and here’s another one of his cartoons on Obamanomics.
Varvel is the best at exposing the spending-cut hoax in DC, as you can see from this sequester cartoon and this deficit reduction cartoon. This cartoon about Bernie Madoff and Social Security, however, is at the top of my list.


Join the conversation as a VIP Member