Editor's note: This piece was co-authored by Michael Talent.
Trying to figure out what the “official” unemployment rate means can be very frustrating. Much of what we hear is complex and counter intuitive. The numbers seem inconsistent with what people are experiencing and many people are simply losing interest. We hear about growth in the non-institutional population, a decline in the labor participation rate, people who are unemployed and want a job not being counted as unemployed just because they haven’t looked for a job in 30 days, and people who are working part time because they are unable to find full time employment being counted as fully employed. Even the Bureau of Labor Statistics breaks down the jobs data in six different ways and calculates six different unemployment rates.
Clearly, the employment situation is better than when unemployment peaked in October 2009 and there has been some positive economic news, particularly in the February jobs numbers. Yet large numbers of people are still unemployed and jobs are still hard to find. When a company announces open positions, the line of job seekers is long and snakelike as hundreds, if not thousands, of unemployed Americans wait for a chance to apply. There is a sense that while things could be worse, something is amiss. Is the unemployment picture really improving? Are the government’s economic policies working or masking serious underlying problems? We need a simple metric that tells us whether the economy’s is generating enough jobs. So, we decided to propose one.
In an effort to cut through the clutter, we went back to the basics. While the economy has been “recovering,” our employable population has also been growing. On average, about 119,000 people join our labor force each month and they need jobs. Everyone acknowledges that for there to be a genuine recovery, the economy must create sufficient jobs both for people coming into the labor force and for those who are already unemployed. Our goal was to come up with a simple method to determine whether our economy is creating jobs sufficient to meet this demand.
We call this new metric the employment/population growth ratio, or simply the “Growth Ratio.” We utilized the underlying data from the BLS’s “household survey.” The Growth Ratio is simply the ratio of the year-over-year growth in household employment divided by the year-over-year growth in the non-institutional population—that is, the number of people who could be in the labor force. So, for example, in order to calculate the ratio for February 2013—the most recent month for which we have data—we calculated the percentage growth in household employment since February 2012 and the percentage growth in the non-institutional population over the same period. The ratio is the percentage growth in household employment divided by the percentage growth in the non-institutional population. In this way, we have a number that tells us whether job creation is keeping pace with, running ahead of, or falling behind population growth. To produce a true economic recovery that would meaningfully reduce the unemployment rate, employment growth should be larger than population growth.
Recommended
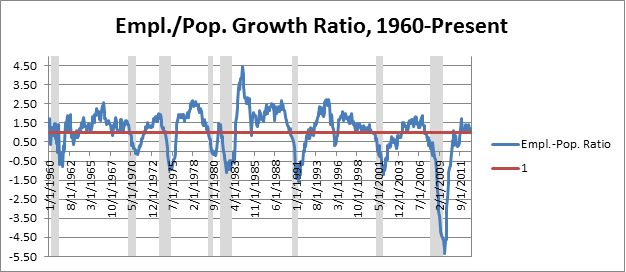
A Growth Ratio equal to one indicates that employment grew as fast as the population and the unemployment rate should remain unchanged. A negative ratio indicates that employment fell over the year. A Growth Ratio above one indicates job growth in excess of population growth, which should reduce the number of unemployed people in the labor force. A ratio between zero and one indicates that, while employment grew, it grew slower than the population. We began our series in 1960 and have it current through February 2013. During this period, the population grew, year-over-year, for each month in the series. We have highlighted in gray recession months, as dated by the National Bureau of Economic Research.

As this chart demonstrates, during the 2007-09 recession, employment fell, on average, 2.34 times faster than the population grew on a yearly basis. That is, the decrease in the number of people working was over twice as fast as the increase in the number of people who could work, which created a huge jobs deficit. In addition, the recession saw both the deepest and longest dip in the Growth Ratio since 1960, with 27 consecutive months of negative employment growth relative to population growth.
This supports the administration’s claim that it inherited a mess. However, while the Growth Ratio turned positive in September 2010, it took until October 2011 for the Growth Ratio to consistently break 1.0 (the point at which employment grew as fast as the population). As such, for over a year after the economy stopped shedding jobs, the number of jobs the economy created, in a year-over-year time frame, failed to exceed year-over-year population growth on a consistent basis.
Such an anemic growth ratio is unexpected for a bust of such magnitude. There appears to be a rough correlation between the depth of a recession and the size of the recovery following it. This is to be expected. A deep recession would leave many people unemployed. The presence of such a large amount of “slack” in the labor market should result in a very high Growth Ratio, as the recovery generates jobs both for the people entering the labor market and those who found themselves unemployed in the downturn. However, this is a phenomenon that we have not seen with the current recovery.
For example, consider 2012, arguably the best post-recession year for job growth, the Growth Ratio averaged 1.21. That is, yearly employment growth was only 1.21 times faster than yearly population growth. Last month, the Growth Ratio was only 1.05—that is, from February 2012 to February 2013, employment growth barely beat population growth.
In the 30 months since the Growth Ratio turned positive, there were 18 months in which the ratio was greater than 1.0, and 12 in which the ratio was less than 1.0. On average, the ratio has been less than one, at 0.95. In short, yearly employment growth has, on average, failed to beat yearly population growth each month during this recovery. Why then, did the unemployment rate decline?
The reality is that there would have been virtually no improvement in the unemployment rate if the increase in the employable population corresponded with a similar increase in the labor force—that is, if the labor force participation rate had stayed the same. As the Growth Ratio indicates, the decline in the “official” unemployment rate—despite an increase in the employable population—means that relatively fewer people are choosing to participate in the labor force. That is, the labor force has deteriorated.
The BLS job numbers for February support the results the Growth Ratio produced. According to the BLS release, the labor force participation rate is 63.5%, not only the low mark for President’s Obama’s tenure but the lowest rate since September of 1981. The BLS also noted that of people “not in the labor force,” there are 6,821,000 who “want a job now.” Adding these individuals back into the labor force and the ranks of the unemployed produces an unemployment rate of 11.6%.
What is the significance of these numbers? We are now two and a half years into the recovery. Considering the magnitude of the job loss during the 2007-09 recession, there should be a “slingshot” effect which causes the economy to create jobs to make up for the jobs lost during the downturn, and then expand opportunities for young people entering the labor force. That is, we should see a Growth Ratio well above 1.5. That has not happened here; the American economy is still over 7 million jobs behind where it should be just to compensate for the jobs lost during the recession plus the population growth that occurred in the interim.
That is why the lines for each new good job are so long despite the recovery. America needs pro-growth policies, like tax, regulatory, and entitlement reform, to sustain and deepen economic growth. The Ryan budget just introduced in the House of Representatives would be a good start. Otherwise, the young people entering the labor market, and the older workers who have been laid off, are going to wait a long time before they find a job.


Join the conversation as a VIP Member