


No one will remember 2006 as one of our nation's greatest years. But how are we doing now compared to then?
By many measures, not nearly so well.
The economy grew faster in 2006 than it has in any year since.
That year, real gross domestic product increased by a modest 2.7 percent, according to the Bureau of Economic Analysis. That was down from the 3.8 percent growth of 2004 and the 3.3 percent growth of 2005. But real GDP has not grown by more than 2.5 percent in any year since 2006.
The last recession began in December 2007 and ended in June 2009 -- seven years ago.
But America has seen 10 straight years (2006 through 2015) without a single year of 3 percent growth in real GDP.
In the first quarter of this year, real GDP grew at an annualized rate of just 0.8 percent.
The median household income in the United States (in constant 2014 dollars) was larger in 2006 ($56,598) than it was in 2014 ($53,657), the latest year for which the Census Bureau has published a figure.
But as the Census Bureau noted in its latest annual report on income and poverty in the United States, published last September, median household income in this country hit its high point at the end of the last century.
"Median household income was $53,657 in 2014, not statistically different from the 2013 median in real terms, 6.5 percent lower than the 2007 (the year before the most recent recession) median ($57,357), and 7.2 percent lower than the median household income peak ($57,843) that occurred in 1999," said the Census Bureau's report.
The federal government's debt has more than doubled since 2006.
Recommended

On the final business day of 2006, the total federal debt was $8,680,224,380,086.18, according to the U.S. Treasury. As of last Friday, it was $19,214,514,064,181.20.
That means the federal government owes $10,534,289,684,095.02 more now than it did at the end of 2006.
The $8,680,224,380,086.18 in federal debt as of the end of 2006 equaled about $59,466 for each of the 145,970,000 people who, according to the Bureau of Labor Statistics, had a job in December 2006.
The $19,214,514,064,181.20 in federal debt as of Friday, equaled about $127,223 for each of the 151,030,000 people who had a job in the United States this May.
Federal debt per worker has increased by about $67,757 since 2006.
The federal government not only borrowed less back in 2006, it also taxed and spent less.
In fiscal 2006, according to the historical tables published by the White House Office of Management and Budget, the federal government taxed away 17.6 percent of GDP, spent 19.4 percent of GDP, and ran a deficit of 1.8 percent of GDP.
In fiscal 2015, the federal government taxed away 18.3 percent of GDP, spent 20.7 percent, and ran a deficit of about 2.5 percent.
In fiscal 2016, according to OMB's estimates, the federal government will tax away 18.1 percent of GDP, spend 21.4 percent, and run a deficit of 3.3 percent.
More Americans are dependent on the federal government now than in 2006.
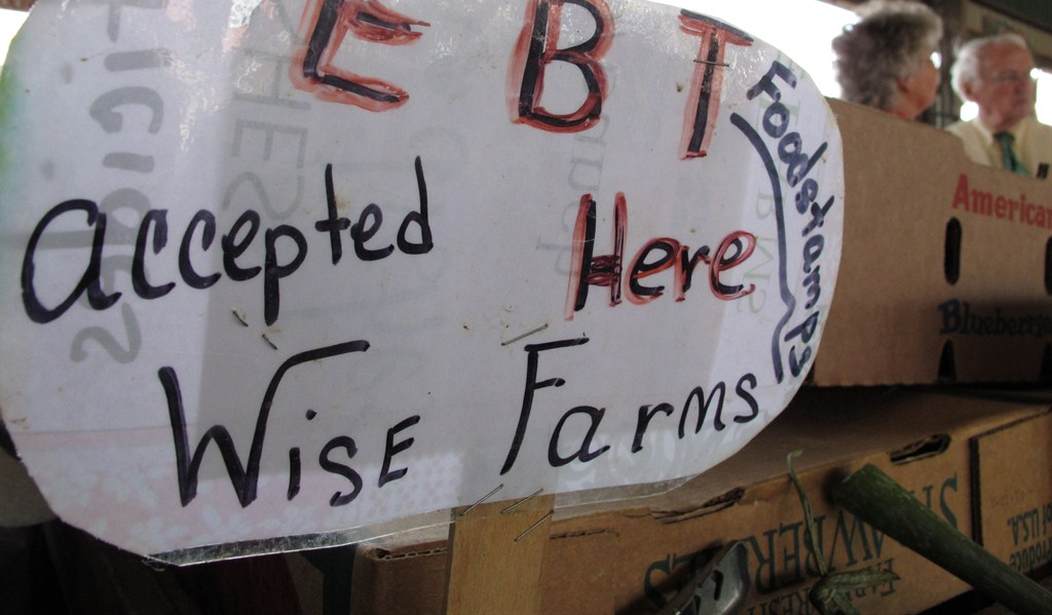
In the average month of fiscal 2006, for example, approximately 26,549,000 people participated in the Supplemental Nutrition Assistance Program (food stamps), according to the U.S. Department of Agriculture. Given that there were about 144,815,000 people employed in the United States as of September 2006 (the last month of the fiscal year), that equaled about 1 food stamp participant for each 5.5 persons with a job.
Food stamp participation peaked in fiscal 2013, with an average participation of 47,636,090. Given that there were about 144,447,000 employed as of September 2013, that equaled about one food stamp participant for each 3 persons with a job.
As of February 2016, there were still 44,391,436 people participating in the food stamp program, while there were 151,074,000 persons employed. That means there was about one food stamp participant for each 3.4 persons with a job as of that month.
What America needs to see a true recovery is not just a span of years without a recession, but a return to the principles of limited government and self-reliance.


Join the conversation as a VIP Member