


The U.S. Census Bureau just released its latest annual estimates of population changes across the United States. This is an early Christmas gift for economists and demographers everywhere. The new estimates show how states have grown since the last full Census in 2010 and provide some clues for what we can expect from the 2020 Census. Of course, of special interest to those within the halls of Congress, the 2020 Census will alter the makeup of Congressional seats across states during the once a decade reapportionment and redistricting process.
Congressional seats are apportioned based on the number of residents within a state. If the last year’s population growth patterns were to continue, the average congressional district in 2020 will contain roughly 763,000residents (total estimated U.S. population/435). Based on new numbers from the past year, a total of nine states are now projected to lose seats in 2020 (AL, IL, MI, MN, NY, OH, PA, RI and WV). The state with the largest potential for losses is Illinois, a state which has been on the losing end in many of the past rounds of reapportionment, and could very well lose two additional Congressional seats in 2020.
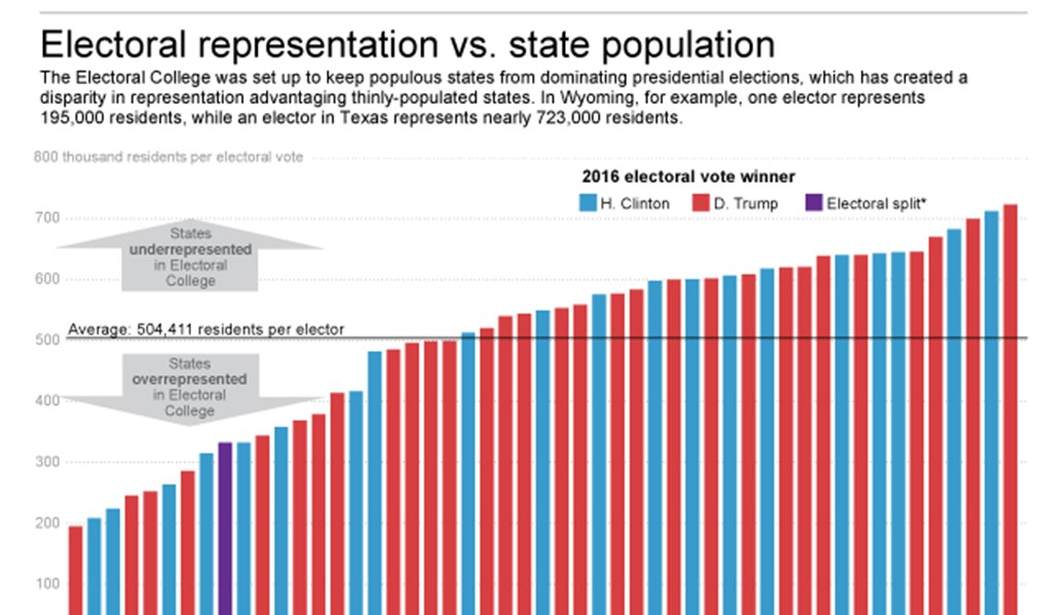
On the other side of the equation, six or sevenfast-growing states stand to gain (AZ, CO, FL, MT, NC, OR and TX). Florida and Texas are the likely big winners, as current projections show Florida will gain two new seats and Texas will gain either three or four new seats.Because presidential elections are determined by the Electoral College -- each state congressional seat is worth one electoral vote -- this could have national implications beyond the control of Congress.

More importantly than the politics of migration changes, the Census data on domestic migration helps us all measure how some states continue to attract new residents, while others continue to hemorrhage Americans to the other states. Domestic migration takes away the effects of birth rates, death rates and international migration and focuses on where Americans choose to move. Many policy analysts believe domestic migration numbers are the most helpful when looking to answer the “why” question of migration decisions.
The domestic migration pattern of the past year paints a stark picture. A quintet of states (New York, Illinois, California, Pennsylvania, and New Jersey) lost more than 500,000 residents in total this past year. Each state ranks in the bottom 15 in the Rich States, Poor StatesEconomic Outlook. By contrast, four of the five states experiencing the largest levels of domestic migration growth (Florida, Texas, Washington, Arizona, and North Carolina) landed in the top 15 for economic outlook. The only outlier in that group, Washington, is one of the nine states that avoid levying a personal income tax on state residents.
The idea that Americans “vote with their feet” towards locations with the best economic opportunity has been the central theme of Rich States, Poor States: ALEC-Laffer State Economic Competitiveness Index for the past decade. The Economic Outlook ranking within the report looks at current state government policies (including personal and corporate income tax rates, property tax burdens, and right-to-work status) to determine prospects for future state growth.
Rich States, Poor States has shown how the states that avoid personal income taxes have seen significantly better rates of economic growth than high income tax states. Of the nine states with no personal income tax, seven experienced positive domestic migration in 2015, totaling more than 460,000. However, eight of the nine states with the highest personal income tax rates experienced net domestic out-migration,exceeding 361,000 in aggregate.
States which expand economic opportunity through reducing wasteful government spending, limiting the tax burden, and streamlining regulations are attractive locations for businesses and individuals alike. These new residents pursue opportunities and create opportunities for others. The continued exodus of families away from less economically competitive states and movement towards other regions more hospitable growthremains evident in the new Census numbers. Americans continue to vote with their feet – and they are voting strongly in favor of states who create an environment conducive to economic growth and opportunity.


Join the conversation as a VIP Member