


I’m very worried about the burden of government spending.
Moreover, I’m quite concerned that poorly designed entitlement programs will lead to fiscal disaster.
And I’m especially irked that Obama made the problem worse by ramming through yet another misguided and costly health care entitlement.
Given this background, you can imagine that I was very interested (and depressed) to see that Veronique de Rugy of the Mercatus Center put together some very important charts and analysis based on new fiscal policy projections.
After crunching the new numbers from CBO, here’s her bottom line conclusion.
…data from the Congressional Budget Office’s (CBO) recently released update to its Budget and Economic Outlook to show the trends and components of projected revenue and outlay increases. …growing entitlement obligations and net interest payments are projected to push outlays (spending) to grow faster than revenues over much of the next decade.
She also produced a chart showing the ever-rising burden of both taxes and spending. Pay close attention to how the numbers get worse at a rapid rate over the next 10 years.
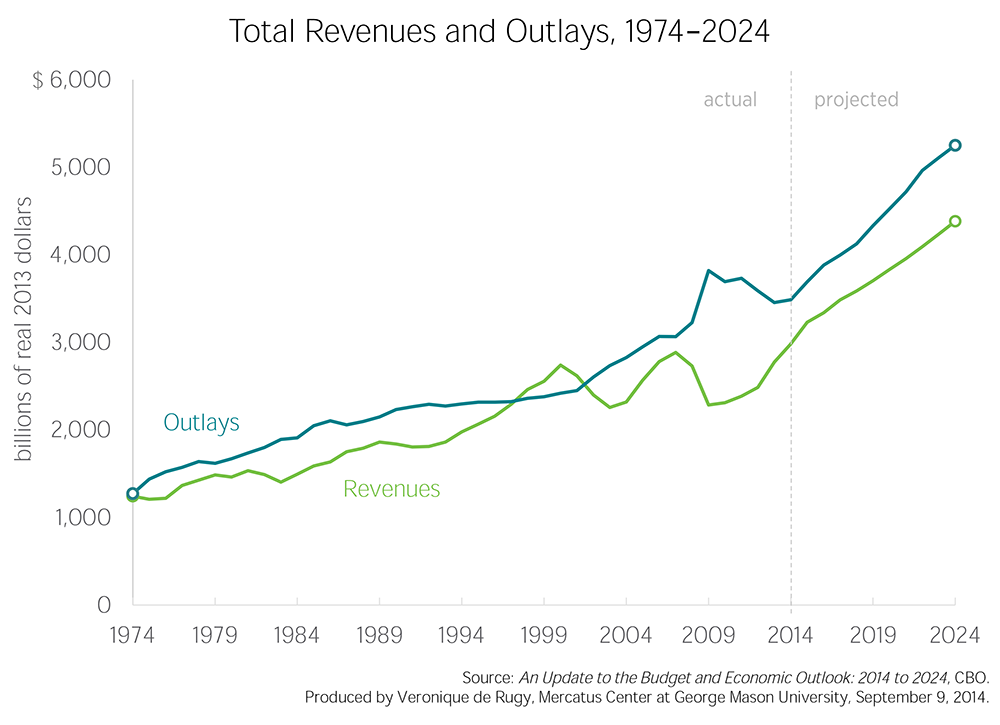
There are two important takeaways from this data.
First, it should be abundantly clear that Washington is not suffering from inadequate tax revenue. Receipts are projected to rise in nominal dollars, in inflation-adjusted dollars, and as a share of GDP.
In other words, America’s long-run fiscal problems are solely a result of a rising burden of government spending.
Second, on the topic of government spending, it’s important to understand that the problem is overwhelmingly caused by entitlement programs. Social Security is part of the problem, but the real issue is government-run healthcare.
Recommended
The President claimed Obamacare would “bend the cost curve.” But he wasn’t truthful since the White House implied the legislation would bend the curve down rather than up.
Here’s a second chart showing the breakdown of various spending categories.
As you can see, the problem is entitlements. And the healthcare entitlements deserve the lion’s share of the blame.
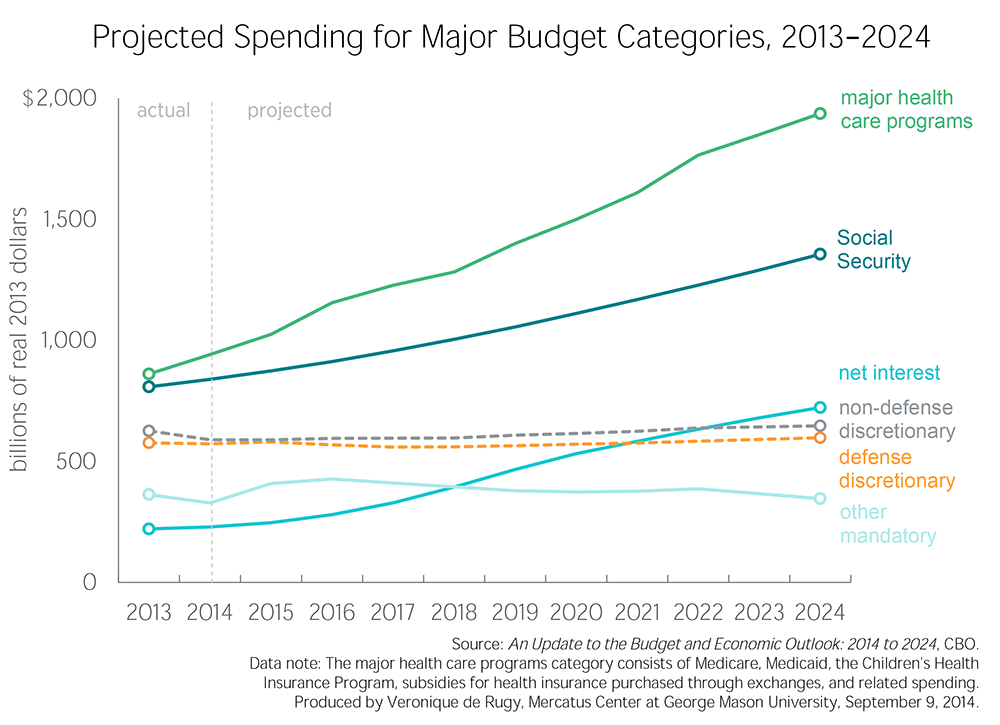
If this chart isn’t sufficiently depressing, then keep in mind that the numbers get even worse after 2024.
Simply states, the United States is doomed to become another Greece in the absence of genuine entitlement reform.
But let’s focus just on the next 10 years. Ms. de Rugy adds some detail.
…CBO projects three large budget categories—major health care programs (consisting of Medicare, Medicaid, the Children’s Health Insurance Program, and subsidies for health insurance), Social Security, and net interest payments on the debt—will account for 85 percent of the total increase in outlays from 2014 to 2024. Total outlays are projected to increase from roughly $3.5 trillion in 2014 to $5.8 trillion in 2024, for a total increase of $2.3 trillion. Major health care programs are projected to grow by $816 billion, which accounts for 32 percent of the total. Social Security spending will grow by $654.9 billion over the next decade, which constitutes 28 percent of the total increase in outlays.
Let’s close, though, with some good news.
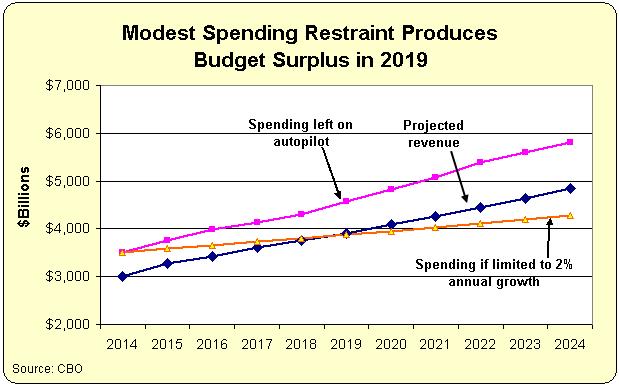
The numbers in the previous charts are all based on what happens if government policy is left on autopilot.
But what happens if politicians impose a modest bit of spending restraint?
According to the latest CBO forecast, inflation is supposed to average almost 2 percent over the next 10 years. So if some sort of spending cap is imposed and outlays “only” grow by a commensurate amount, it turns out that there’s a remarkably quick change in America’s fiscal profile.
As seen in this chart, there’s a budget surplus by 2019. And more important, government spending by 2024 is about $1.5 trillion lower than it would be with the budget left on autopilot.
Here’s a video from a few years ago. The numbers are out of date, but the underlying analysis is still completely appropriate. Simply stated, it’s very easy to balance the budget if politicians simply follow the Golden Rule of spending restraint.
P.S. Since this was a somewhat depressing topic, let’s close with some humor.
A few years ago, I shared a satirical application form for bailout money from Uncle Sam. Well, the New Yorker has an application quiz for Syrian rebels seeking American dollars.


Join the conversation as a VIP Member