A youngster- yes I'm talking about you, Katie Pavlich- emailed me a little while ago about the recent miserable performance of the stock market, saying: "Please tell me something to make me feel better."
Well, Obama can't be president forever. Wall Street is finding out- again- that following conservative fiscal policies really does make a difference.
Again?
Yep. We have done this before and lived to tell the tale.
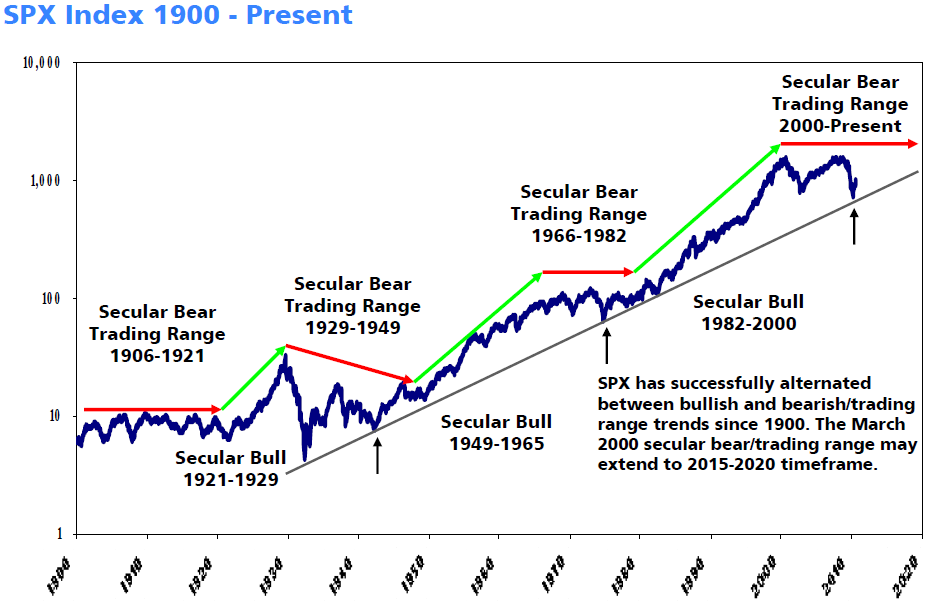
Below are two charts. The first is a chart breaking out the stock market during two liberal ascendancies: Carter's and Obama's; the second shows that we are in the midst of a long-term bear market similar to one we “enjoyed” during the heyday of the Great Society.
The Great Societies bear market ended with the election of Ronald Reagan.
Obama and Carter were both elected after massive sell-offs in the market, followed by a lipid recovery. The technical patterns of both administrations, as shown below are remarkably similar. Both had robust upswings, followed by sideways market action as federal policies put a stranglehold on the economy.
Well what about the George W. Bush market crash? asked one commenter on my original blog post on this topic. Well, what of it? I didn’t say we needed Republican policies, I said conservative fiscal policies, including less regulation. I think I can compare Bush’s fiscal policies to the fiscal policies of both Nixon and Ford in the sense that each needed to spend more at home on domestic policies in order to have a freer hand in foreign policy.
Recommended
Eventually, those fiscal policies caught up with the country, however.
Those misplaced policies don’t free Obama up to follow even worse ones.
As the RNC reminded us today with a few interesting quotes via email, the bounce off the bottom for the stock market that Obama has enjoyed needs to be put into historical perspective. Carter enjoyed a similar bounce, after Ford, as shown in the chart below.
In his State of the Union address President Obama claimed, “We are poised for progress. Two years after the worst recession most of us have ever known, the stock market has come roaring back. Corporate profits are up. The economy is growing again.”
But here’s two more nuggets from the RNC to provide perspective: “The Stock Market Is Poised Today To Do Something It Has Not Done In Over 33 Years: Decline For Nine Straight Sessions.” (Mark Hulbert, “Dow’s Losing Streak Now In Ninth Day,” MarketWatch, 8/4/11 via RNC)
“The last time the Dow Jones Industrial did that, in fact, was Feb. 22, 1978, when Jimmy Carter was president and the country was struggling to come to grips with a period of anemic economic growth and high inflation.” (Mark Hulbert, “Dow’s Losing Streak Now In Ninth Day,” MarketWatch, 8/4/11 via RNC)
Here’s the chart to further emphasize the point. Chart courtesy Yahoo Finance.
The trendline on the S&P chart below would also suggest that the market is entering a period not unlike that from 1971 to 1973 when the market attempted to break above the trend, but instead traded sideways for the next 9 years.
Interestingly, even after the market enjoyed an historic bull run in the 1980s, the S&P didn't break well above the trend until 1994.
The chart puts in perspective the long range nature of how markets react to events and federal policies. Rather than being drivers of events, the markets are just reflections of things that are going on in society at large.
The period from 1966 to 1982 is a good example of that. It looks like the economy was on drugs during that period, until the recovery began when it just said "no." The drug of choice of course was dollars and government spending. It took another 12 years for the economy to revert back to normal growth.
Looking at a longer term perspective, however, it's a very good time to be investing in stocks if your investment horizon is 10-20 years or more.
Of course if you want to use investments for little things like retirement the first thing you have to do is give Obama the boot.
Looking at the charts, we can’t afford Obama. Not only is spending out of control but the greatest component of strength for the U.S.- our economic might- is being fritted away.
Even liberals will have to acknowledge at some point that their precious social programs will end up getting the chop if the economy doesn’t get moving.
Soon.
(Source: Barry Ritholtz) 
See more top stories from Townhall Finance:
| Mike Shedlock | Cash Hoarding Starts |
| Bob Goldman | Stepping Up to Trickle-Down Anxiety |
| Bill Tatro | Obama's Depression by Other Means |
| John Ransom | Liberals Come Home to Roost: Obama vs. Carter |
| Bob Beauprez | Super Committee Deficit Theater |
| Email Ransom | thfinance@mail.com |
| http://www.facebook.com/bamransom | |
| http://twitter.com/#!/bamransom |


Join the conversation as a VIP Member