I’m not a very exciting guy. It’s Saturday afternoon and I’m perusing the Budget and Economic Outlook from the Congressional Budget Office.
But sometimes it pays to be a nerd because I just found an interesting tidbit of information. Here’s what CBO says about the anemic economic output we’re experiencing compared to the growth we should be enjoying.
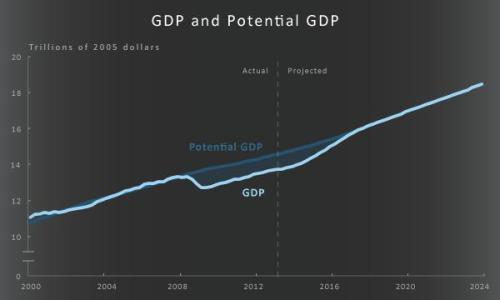
…output is likely to remain below its potential (or maximum sustainable) level until 2017—almost a decade after the recession started in December 2007. CBO estimates that real GDP in the fourth quarter of 2012 was below its potential level by about 5½ percent; that gap is only modestly smaller than the gap (of about 7½ percent) that existed at the end of the recession in mid-2009 because growth in output since then has been only slightly faster, on average, than growth in potential output.
Let’s translate this bit of jargon into English.
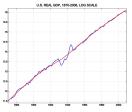 What CBO actually is saying is that the economy hasn’t enjoyed the bounce of above-average growth that normally follows a recession (and we have more than 130 years of data showing this is the normal pattern). As a result, instead of recovering all the lost output associated with the downturn, we’re still suffering from sub-par levels of output.
CBO specifically says that we were “about 5½ percent” below potential at the end of last year. That’s about $880 billion of lost output. Not exactly a ringing endorsement of Obamanomics.
But that’s just part of the story. CBO also looks at the cumulative output gap.
With such a large gap between actual and potential output persisting for so long, the cumulative loss of output relative to the economy’s potential between 2007 and 2017 will be equivalent to nearly half of the output produced last year.
Recommended
Since output last year was $16 trillion, the cumulative output gap is $8 trillion. That’s a ton of money, even by Washington standards.
Here’s a chart from CBO showing this output gap.
By the way, I’m not sure I believe CBO’s estimate that we’ll get back to the trend line by 2017. Why expect good things when the economy is saddled by excessive taxation, wasteful spending, and burdensome regulation?
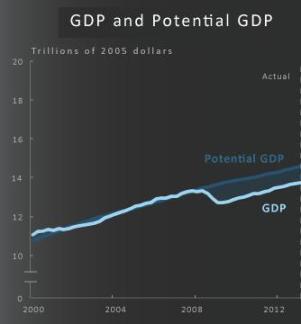
All that we know for sure is that the economy has been lagging, which is starkly evident if we simply look at actual data.
By the way, if you think I’m cherry picking numbers to make Obama look bad, my first reaction is to laugh since CBO leans way to the left and has zero reason to make Obama look bad. Remember, these are the clowns that tried to justify Obama’s Keynesian stimulus scheme.
But if you don’t want to believe the CBO data for inexplicable reasons, how about the Washington Post, which certainly is on the left side of the political spectrum? Surely they’re not part of the vast right-wing conspiracy, right?
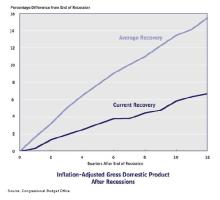
Check out this chart they posted comparing the current recovery to a normal recovery, though you won’t be surprised to learn that they conveniently waited until after the election before sharing this vital bit of information.
Or what about the Minneapolis Federal Reserve, which has an interactive website enabling a reader to compare all the business cycles since the end of World War II.
These charts show both employment and output for every one of those business cycles. You can click to see larger versions, but all you need to know is that the current business cycle is the red line – and it happens to show that Obamanomics has generated the worst results whether we’re looking at jobs of GDP.
None of this is to suggest, by the way, that Obama’s policies caused the recession. That happened on Bush’s watch.
But I am stating that Obama’s big-government policies have played a role in keeping the economy from enjoying a strong recovery. That’s been no post-recession bounce.
Ronald Reagan also inherited a dismal economy. He had to deal with high interest rates and inflation rather than a banking crisis, so I don’t know which President was dealt a worse hand of cards. But I know that Reagan’s policies of free markets and smaller government helped trigger an economic boom.
Obama, by contrast, basically has continued Bush’s policies of intervention and bigger government. No wonder we’re suffering a multi-trillion dollar output gap.






Join the conversation as a VIP Member