
Several factors have put the energy markets in a position to rally sharply higher over the near-term. Last week, the action by European officials to create a plan to fix the sovereign debt and banking crisis helped stop the decline in crude oil and gasoline while launching the start of a breakout to the upside.
This week the talk of economic stimulus and planned moves by Iran in the Strait of Hormuz boosted prices of both of these commodities on Tuesday. Although these factors have changed the trend to up on the daily chart, the rallies may be muted by major retracement areas. Fundamentally, there are concerns that slow U.S. economic growth may actually cap demand for energy.
Crude oil and gasoline futures rose sharply on Tuesday as traders turned their focus away from the possibility of a slowdown in the U.S. economy, instead choosing to react to the possibility that central banks from China and Europe may provide additional stimulus to the global economy in the form of interest rate cuts.
Traders also reacted to the news that Iran had drafted a bill to block the Strait of Hormuz for oil tankers. The possibility of a geopolitical event is what crude oil bulls have been waiting for since the market started its huge decline in March. The news certainly frightened shorts to cover. Whether there were enough bullish speculators in Tuesday’s pre-holiday market will have to be determined later in the week.
The word “possibility” is used a lot when trading the energy markets because much of the price action is based on uncertainty. Traders react quickly when there is even a hint of a threat to supply and this week’s action is no exception.
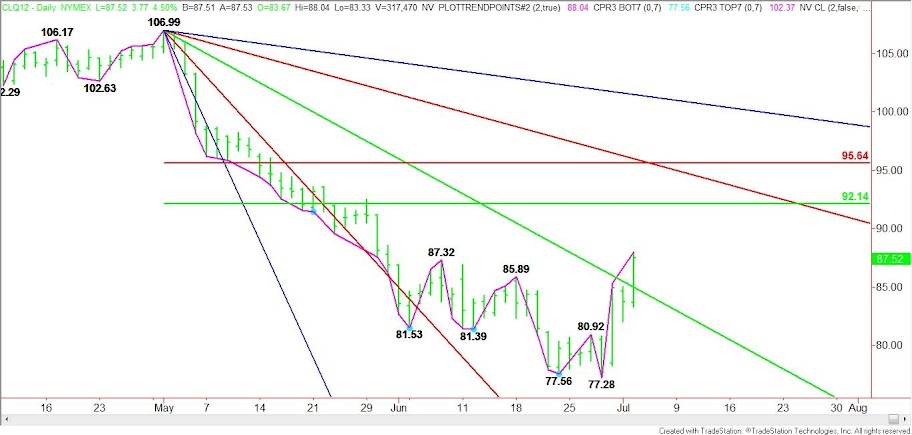
The August Crude Oil futures chart indicates that this market has plenty of room to the upside. Last week the main trend turned up on the daily chart when the market crossed the swing top at $80.92. A second and third wave of breakout buying and short-covering occurred when the swing tops at $85.89 and $87.32 were violated.
Gann angle analysis shows that a key obstacle was overcome when the market crossed a downtrending Gann angle at $84.99. The momentum during this breakout suggests the market may move up to the next Gann angle currently at $95.74.
Based on the main range of $106.99 to $77.28 or the March to June sell-off, August Crude Oil has a clear shot at reaching its retracement zone at $92.14 to $95.64. This is the key area that could cap gains especially if a test of this zone ties in with a bearish fundamental event.
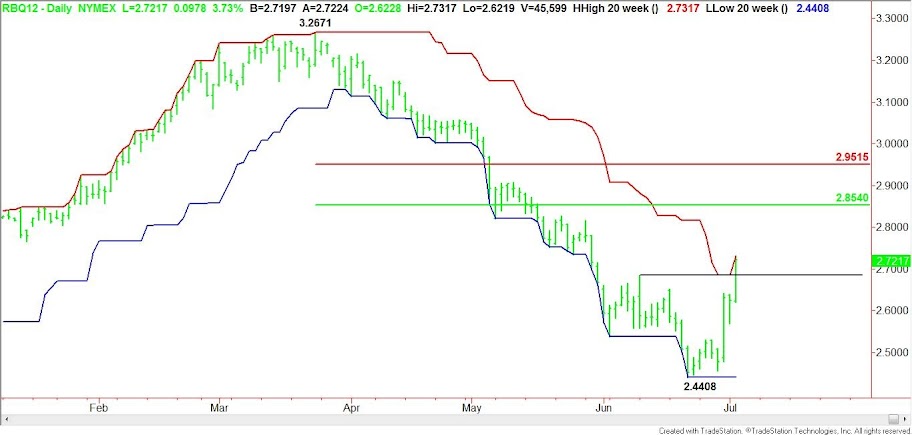
This chart depicts August Unleaded Gasoline futures and its relationship to the 20-day high and the 20-day low. On July 3, this market crossed the 20-day high, triggering a change in trend to the upside. Although this is a trend indicator chart that is followed by many professional traders, this market may run into resistance at 2.8540 to 2.9515 over the near-term. This price zone represents a normal retracement of the 3.2671 to 2.4408 trading range.
With many analysts expecting the current move in crude oil and unleaded gasoline to be short-lived because of the oversupply situation, these markets may be ripe for more upside action especially since the charts indicate there is plenty of room to the upside.
Trading crude oil means understanding the meaning of uncertainty. Keep in mind that traders are reacting to the threat to supply. This is the way that futures markets work. Trading the energies also means understanding who is running the show. There is typically a clash between the trend and counter-trend traders. Right now the trend traders may have the upper-hand but look for more counter-trend action once these markets complete their retracements.