


There is an interesting irony. The stock market acted well ahead of the peak China coronavirus, then it tumbled on cases outside of China, and now it is under pressure as the United States braces for organic spread infections. Meanwhile, coronavirus cases have slowed dramatically in China, and overall infections may have peaked around the world. We have always known some cases would slip into the United States, but it’s believed officials are prepared. Moreover, I think the Center for Disease Control (CDC) has done a fantastic job, thus far, and has a game plan ready to arrest outbreaks.
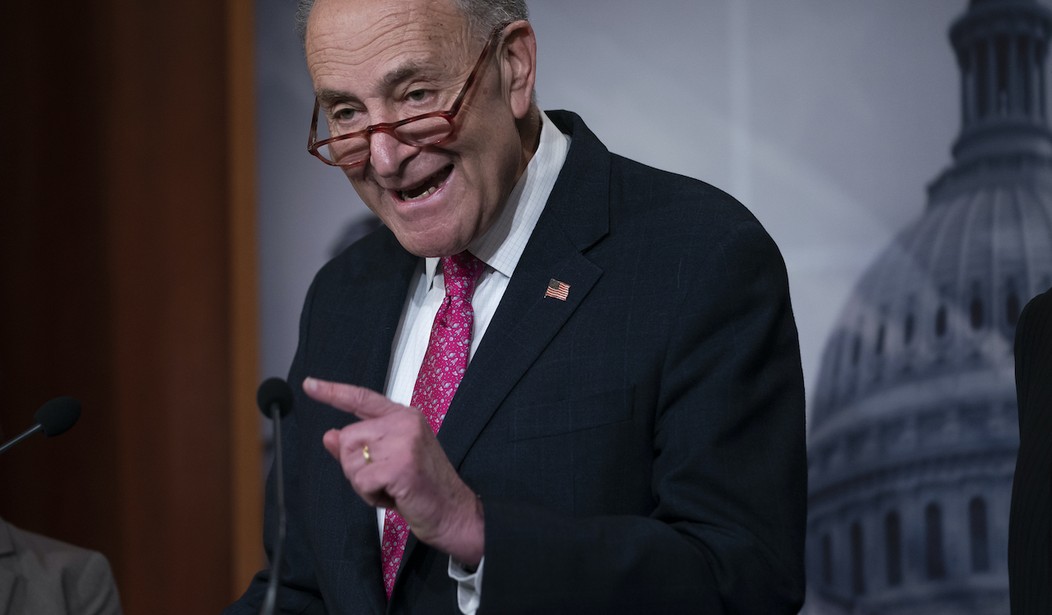
The amateur epidemiologists have full control of the soapbox, and some, like Senator Chuck Schumer, don’t care how incendiary their comments. I get there is war in Washington, D.C., but his comments about the administration being flatfooted, and somehow, it’s too late to save the country, were like throwing gasoline on a raging fire.
Meanwhile, the race is on for a treatment around the world that promises a record short amount of time to going into human trials – just a few months from identifying the pathogen.
81,259 Coronavirus Infections | |||
Active | Closed | ||
39,3221 | Mild | 30,317 | Discharged |
8,851 | Serious | 2,770 | Deaths |
48,172 | Total | 33,087 | Total |
https://www.worldometers.info/coronavirus/
Be that as it may, investors and society have to grapple with a market-driven by non-stop reports of the worst-case scenario happening in the United States. The inevitable pandemic doesn’t have to be inevitable, and yes, there will be a point when it’s all resolved (although, there are those pushing the notion of coronavirus showing up every winter), and stocks will stage a rebound.
I hate to say this, but there are forces out there that want the market to implode and hope to deflate the American animal spirits that have carried the economy and stock market.
Snap Back versus Clap Back
Most market investors and observers know the short-lived impact of similar events like the SARS and Zika virus, which both saw dramatic pullbacks of more than 12% followed by swift rebounds. Well now, we are being told this time it’s different, even with ultra-low interest rates and a much stronger economy.
The volume on the machine that has been talking the market down will remain at full blast for a while, which is why its important for investors to understand history. The last six times the market endured back to back daily declines of 3% or more, the market was higher one month later. Note, four of those times was in 2008, underscoring the wild volatility of the time. Overall, the market was down a month later only once under these circumstances since 1993.
Oversold Bounce from Back to Back 3% Declines Since 1993 | ||
Date | Two - Day % Change | Next Month % Change |
7.19.2002 | -6.46 | +12.62 |
10.7.2008 | -10.57 | -3.84 |
12.27.2008 | -7.38 | +2.04 |
11.6.2008 | -6.44 | +0.15 |
11.12.2008 | -8.57 | +3.69 |
11.10.2008 | -11.72 | +15.38 |
8.24.2015 | -9.03 | +2.16% |
2.25.2020 | -6.25 | ??? |
Source: Bespoke | ||
Dow Jones Industrial Average at 200 day moving average – historically a great place to buy.
Portfolio Approach


Join the Conversation
VIP members get the ability to comment on articles.