


Yesterday, an engineer at Fox pulled me aside and told me he was considering selling his 401K. He noted his 401K had come back nicely, and he was getting worried since he would be retiring in a few years. I asked if he would also be retiring from an active lifestyle, and if the money he’s accumulated would be enough.
That’s when he told me he would get back into the market at some point.
This is the real question for anyone leaning toward selling everything. Initially, those instincts seem wise as the market remains under pressure. At some point, the market finds a bottom and then rebounds. Picking that bottom is close to impossible, especially for those that have already shown a low tolerance for risk and pressure.
What has happened too often throughout history is that the market is eventually bought back, but at levels higher than initially sold, or investors keep waiting. Missing the bounce also adds the element of embarrassment, which only deepens as the market moves higher. That’s the conundrum that investors have been dealing with since March 2009 when the market bottomed.
Individual investors sold $114 billion in stock funds from September 2008 to March 2009 with the majority of dumping coming into the trough of the meltdown.
…Back to my engineer friend.
I think he decided not to panic, and I’m sure until the current volatility eases, he will remind me he stayed because of me. I’m cool with that since I was also the person pleading with folks not to panic back in March 2009. I will say over the years; many folks have offered me unsolicited thanks. The thing is: this is not March 2009, and I don’t think it’s September 2008 either.
However, the market is obviously worried; and yet, it’s not reacting to fundamentals and that’s what investors must keep in mind. That’s not to say at some point, headlines won’t spook consumers and make recession a self-fulfilling event.

Ultimately, investors must remember these are companies in their portfolios. There are so many companies that I want to be a part-owner of over the next five years. That’s how everyone must think about the stock markets. There will be ups and downs, and there will be economic slowdowns and even recessions, but there will also be mega business winners. Those mega winners probably had lower share prices yesterday, which means opportunity. At the very least, it shouldn’t mean panic.
Potential Recession
Yesterday, the yield on the two-year Treasury eclipsed the ten-year, sending the equity market into a tailspin. At the close, the two-year yield was 99.99% of the ten-year:
- Two-Year: 1.584%
- Ten-Year: 1.581%
I’m not sure if this time is different, but that would only mean a rebound in the market could be strong. It’s something you want to participate in, and if variables - like $16.0 trillion in negative global bond debt, along with the uncertainty of the trade war - means we escape a recession for more than two years, then that bodes even better for the stock market.
Big Downside Test
There are a lot of ways to determine the downside test from trend lines to moving averages. I’m looking at two things:
- Recent Lows
- 200-Day Moving Average (note: the Dow has already shattered its 200- Day Moving Average)
Keep Support Levels | Dow Jones Industrial | S&P 500 | NASDAQ Composite |
Recent Low | 25,440 | 2,881 | 7,702 |
200 Day MA | 25,584 | 2,795 | 7,569 |
The Fed Problem
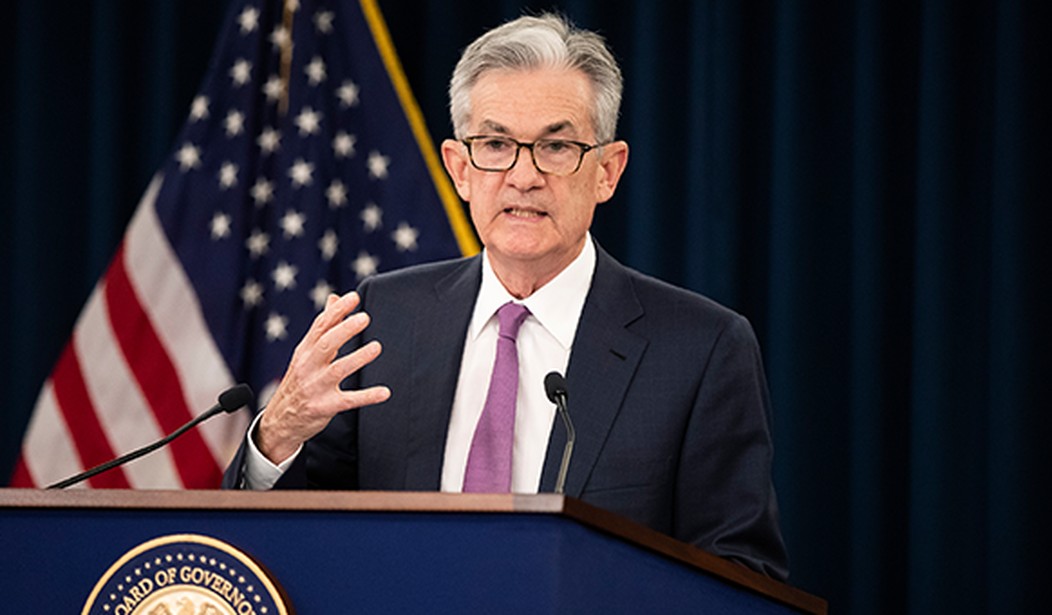
While I think that the policy actions, including the last two interest rate hikes, were huge mistakes in my mind, the greatest problem for the stock market has been verbal miscues from Fed Chairman Jerome Powell.
The three comments from Powell roiled the markets big time because they were misplaced. This has eroded the Fed’s credibility. I know Powell is under huge public pressure from President Trump, but I hate that it seems he’s allowing it to influence policy.
October 3, 2018
“Interest rates are still accommodative, but we’re gradually moving to a place where they will be neutral…we may go past neutral, but we’re a long way from neutral at this point, probably.”
May 31, 2019
“We suspect transitory factors may be at work”
July 31, 2019
“We’re thinking of it essentially as a mid-cycle adjustment to policy”
Next Move
Now, Powell & the Fed have to ponder a rate cut before the next Federal Open Market Committee (FOMC) gathering next month. The dilemma is how to do this and not look too nervous. Powell has fancied himself a ‘Cool Hand Luke’ kind of Fed chairman, and he would be loath to panic now.
Just as cutting six months after hiking rates in December caused Powell to act as though it was a short- term action and not a ‘de facto’ admission that the Fed went too far. The thing is that he promised to stay ahead of the curve and may need to listen to the market and take action.
I continue to hope President Trump takes a break on the Powell/Fed tweets, which would let the Fed move without fear of talk they were pushed around. I find it interesting the Street is only modeling a 21.2% chance of a 50 basis points (bps) cut at the next FOMC meeting, although that number was 3.8%, coming into the session.
CME Fed Watch | 175 – 200 | 150 – 175 | 125 – 150 | 100 – 125 | 75 – 100 |
Sept 18 | 78.8 | 21.2 |
|
|
|
Oct 30 | 25.7 | 60.0 | 14.2 |
|
|
Dec 11 | 11.3 | 40.8 | 39.9 | 8.0 |
|
Jan 29 | 6.5 | 28.4 | 40.3 | 21.4 | 3.4 |
The Pulse of American Consumer
The American consumer has kept the USA economy afloat all year long, but they haven’t shown any sign of blind or even risky consumption. In fact, debt servicing as a percentage of household disposable income is low enough for consumers to become more aggressive. However, this is a different kind of consumer. In the last read, savings jumped to 8.1%.
Today, we are going to look to Walmart (WMT) for clues on consumer confidence, the impact of tariffs, and the overall health of the economy. Walmart has been on a roll with four quarters of comp-store sales north of 3%. The pressure would still be on regardless of what they do, but today’s results and guidance will influence the entire market.
Walmart US Comp Store | Traffic | Ticket | Change |
1Q18 | 1.5% | -0.1% | +1.4& |
2Q18 | 1.3% | 0.5% | +1.8% |
3Q18 | 1.5% | 1.2% | +2.7% |
4Q18 | 1.6% | 1.0% | +2.6% |
1Q19 | 0.8% | 1.3% | +2.1% |
2Q19 | 2.2% | 2.3% | +4.5% |
3Q19 | 1.2% | 2.2% | +3.4% |
4Q19 | 0.9% | 3.3% | +4.2% |
1Q202 | 1.1% | 2.3% | +3.4% |
Portfolio
We issued an alert taking a small loss on the Fair Isaac Corporation (FICO) in the model portfolio based on news out of the administration that could severely impact the business model. Everyone’s cash levels should be robust.
Communication Services | Consumer Discretionary | Consumer Staples |
1 | 3 | 1 |
Energy | Financials | Healthcare |
1 | 1 | 1 |
Industrial | Materials | Real Estate |
2 | 3 | 1 |
Technology | Utilities | Cash |
1 | 0 | 5 |
Today’s Session
It’s been a wild morning with Dow Jones Industrial futures, which began early in the morning up:
- +150 points (general rebound)
- -200 points (China saber-rattling)
- +200 points (Walmart result & China olive branch)
American Consumer Rules!
Walmart
Walmart crushed it big time this morning beating Wall Street consensus on revenue and earnings and management guided the rest of the year above consensus.
- Revenue $130.37 billion
- Estimate $130.10 billion
- Earnings $1.27
- Estimate $1.22
Comp store (US Walmart ex fuel) +2.8% (estimate +2.1%)
- Transactions +0.6%
- Ticket +2.2%
- E-commerce +37%
Retail Sales
July retail sales came in more than 100% above consensus, blowing away the street and underscoring the fact the American consumer is strong as confidence continues to be manifested in sturdy spending.
- Headline sales +0.7% (consensus +0.3%)
- Ex- Autos +1.0% (consensus +0.4%)
- Control Group +1.0%
Highlights
- Non-store (internet) +2.8%
- Department stores +1.0% (maybe there will be winners in this otherwise dying retail niche)
- Restaurants & Bars +1.1%
July 2019 | M/M | Y/Y |
Headline | +0.7% | +3.4% |
Ex-Motor | +1.0% | +3.7% |
Motor | -0.5% | +2.3% |
Furniture | +0.3% | -0.02% |
Electronics | +1.0% | -3.4% |
Building Materials | +0.1% | -2.9% |
Grocery | +0.6% | +3.7% |
Health and Personal Care | -0.1% | +4.2% |
Gasoline | +1.7% | -0.0% |
Clothing | +0.7% | -2.4% |
Sporting Goods | -1.1% | -0.5% |
Department Stores | +1.1% | -4.7% |
Internet | +2.8% | +15.9% |
Restaurants | +1.0% | +3.8% |
Manufacturing Rebound?
Philly Fed came in at 16.8 against consensus of 8.0, and a special question indicates consumers prices are expected to be lower over the next year and decade than previous surveyed.
Philly Fed | August | July |
Headline | 16.8 | 21.8 |
New orders | 25.8 | 18.9 |
Prices paid | 12.8 | 16.1 |
Prices received | 13.0 | 9.5 |
Empire Sales | August | July |
Headline | 4.8 | 4.3 |
New orders | 6.7 | -1.5 |
Prices paid | 23.2 | 25.5 |
Prices received | 4.5 | 5.8 |


Join the conversation as a VIP Member